|
Technique
|
Basis
|
Optical components
|
When used
|
Example
|
| Brightfield (BF) | Contrast is generated from absorption of light by pigments in the sample. Pigments may be intrinsic or added. Light is transmitted through the (stained) sample. Köhler Illumination is important for supplying a uniform bright background. Generates colored samples on a bright background. | Field Iris, Köhler condenser, Condenser iris | Stained tissue preparations. |
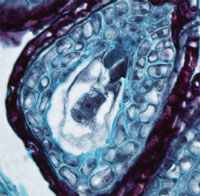 Three-cell plant embryo |
| Darkfield (DF) | Contrast is generated by scattering (reflection, refraction, diffraction) of light from the sample. Especially useful for visualizing reflective samples such as silver grains, nano-particles (Q-Dots), reflective cell walls, etc. Generates bright sample areas on a dark background. Sub-resolution light scattering objects can be detected (but not resolved) using DF. Sample color is the same as the light source (usually white). | Condenser with DF Stop illuminates sample at an angle greater than the objective angular aperture. Only light scattered by the sample is collected by the objective. | Sub-resolvable, reflective particles, some probed tissues (in situ hybridization). Good also for GUS-probed tissues. Shows flagella and cilia on some single-cell organisms. |
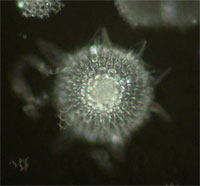 Radiolarian |
| Rheinberg Illumination, "Optical Painting" | Like DF, but uses two different colors instead of black (background) and light (scattered). | Condenser with Rheinberg Color Filter illuminates sample with one color (e.g., yellow) at an angle greater than the objective angular aperture. Background (non-scattered light) is an opposing color (center of Rheinberg filter, e.g., Blue). | Any thin, light-scattering sample. |
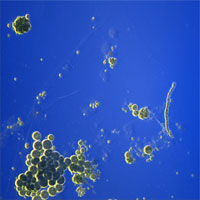 Single-cell algae |
| Polarized Light Microscopy (PLM) | Contrast is generated by polarized light interacting with birefringent (optical anisotropic) samples. Birefringent samples may be identified (by their birefringence number) by using a Full Wave Retardation Plate, and finding the interference color on the Michel-Levy Chart. Weakly birefringent samples (e.g., spindles) may be revealed using a Compensator, which adds a known OPL to sample-retarded light to create a more saturated interference color. | Polarizer produces plane-polarized light to illuminate the sample. Birefringent samples create additional polarized rays that either pass through (parallel to the privileged transmittance plane) or interact at the Analyzer by wave interference. A Full Wave Retardation plate or Compensator (optional) enhances weak birefringence and induces interference colors that can be interpreted using a M-L Chart. | Sample may contain crystalline components (cellulosic cell walls, calcium oxylate crystals), or when identifying crystalline unknowns by determining its birefringence number. |
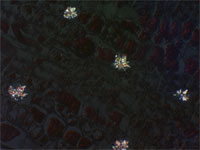 Ginkgo leaf crystals (calcium oxylate) |
| Phase Contrast Microscopy (PC) | Contrast is generated via wave interference between rays passing through a sample vs. background. Light rays passing through sample (higher refractive index) are retarded in phase relative to the background light, and are refracted. When recombined at the intermediate image plane, wave interference occurs and contrast is generated. | Phase Annulus in the condenser illuminates the sample with a cone of light. Light that passes through the sample (higher refractive index) will be retarded in phase up to 1/4 lambda, will be refracted, and will not pass through the phase plate.
Background, unrefracted light passes through a Phase Plate in the objective where it is retarded (or advanced) a known value (1/4 lambda). if -1/4 lambda =Negative Phase Contrast if +1/4 lambda = Positive Phase Contrast |
Used to visualize thin, unstained samples that have refractive index that differs from the surrounding medium.
Artifacts: 1) Phase Halo Very good for identifying bacteria and endospores. Will work with birefringent samples (e.g., cells in plastic petri plates). |
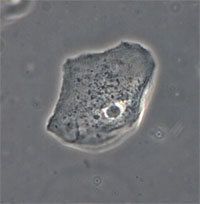 Cheek epithelial cell |
| Differential Interference Contrast (DIC) | Contrast is generated via wave interference between two "Difference Images"; which are polarized images of the sample created by W/N1. Separation (shear, d) is induced by a birefringent Wollaston/Nomarski crystal optically below the sample; The "inverted" W/N2 prism recombines the difference images. Phasing is caused by small optical path differences within the sample and accentuated (biased) by translation of the upper Wollaston (or Nomarski) prism. Interference occurs at the Analyzer. Pseudo-3D image is a representation of OPL and not actual sample geometry. | From light source to detector (eyes, camera): Polarizer, Wollaston Prism, Sample, Upper Wollaston Prism (W2), Analyzer. W2 creates two difference images separated (sheared) by a very small value. W/N2 can be translated to accentuate ("bias") the phasing difference between difference images. The analyzer forces the vibrational plane of these two images to vibrate in a single (privileged) plane. Wave interference occurs at the Analyzer and contrast is generated. | Used to visualize thin, unstained samples that have refractive index that differs from the surrounding medium. Very good for high-resolution optical sectioning.
Will not work well with birefringent samples (e.g., cells in plastic petri plates). |
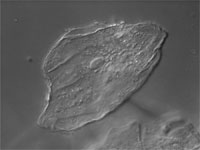 Cheek epithelial cell |
| Hoffman Modulation Contrast (HMC) | Contrast is generated by refraction of light caused by refractive index gradients within the sample: 1) Low to high causes light to bend and pass through a dark (1%) filter 2) Where there is no gradient the light passes through a gray (15%) filter 3) High to low gradient causes light to bend and pass through no filter. The result is an image where refractive index gradients appear dark on one side and light on the other. Pseudo-3D image is a representation of refractive index gradients and not actual sample geometry. |
From light source to detector (eyes, camera): Rotating Polarizer, Condenser Slit Plate (with polarizing sector), Sample, Objective, Hoffman Modulator (in objective lens). | Used to visualize thin, unstained samples that have refractive index that differs from the surrounding medium. Good for high-resolution optical sectioning.
Works with birefringent samples (e.g., cells in plastic petri plates). |
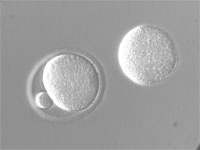
Mouse eggs in plastic plates |
| PlasDIC | Contrast is generated via wave interference between two closely separated, polarized images of the sample. Sample polarization (birefringence) is eliminated by the Polarizer, which is inserted after the sample. Difference Images are then created by a single birefringent Wollaston crystal downstream from the Polarizer. The Analyzer placed after the Prism transforms both image wavefronts into parallel vibrating waves that meet and interfere at the Intermediate Image Plane. Phasing is caused by small optical path differences within the sample and accentuated (biased) by translation of the Wollaston prism. Pseudo-3D image is a representation of OPL and not actual sample geometry. | From light source to detector (eyes, camera): Sample, Polarizer, Wollaston/Nomarski Prism (W1), Analyzer. W1 creates two difference images separated (sheared) by a very small value. The lateral position of W1 determines phase difference (bias), and the analyzer folds together the vibrational plane of these two images. Wave interference occurs at the IIP, and contrast is generated. | Used to visualize thin, unstained samples that have refractive index that differs from the surrounding medium. Very good for low-resolution optical sectioning (10 - 20x). Makes a pseudo-3D image.
Will work with birefringent samples (e.g., cells in plastic petri plates). |

Microinjecting eggs |